
Bearing Down On NAHB’s False Claims About Softwood Lumber Costs And Housing Prices
Summary
The National Association of Homebuilders (NAHB) has been waging a campaign against the trade remedies applied on imports of Canadian softwood lumber since those measures were imposed in 2017. This campaign went into overdrive after the Trump administration announced that it was initiating an investigation that could result in additional measures being applied to U.S. imports of Canadian lumber.
NAHB’s effort knows no bounds. Its reach extends from the halls of Congress to articles printed in the smallest of small-town U.S. newspapers. These articles, and NAHB messaging in general, make several claims about the impact of lumber costs on housing affordability, and about the U.S. industry’s ability to supply its own market. The not-so-subtle message is that the existing measures on Canadian softwood lumber are inflating the cost of new homes, and that any new measures will make things even worse.
The U.S. Lumber Coalition has issued an essay to review existing data on softwood lumber prices, housing costs, and domestic production capacity to assess the accuracy of NAHB’s claims. The data reviewed support the following conclusions.
- First, NAHB’s claims regarding the link between lumber cost trends and housing affordability are greatly exaggerated. The increase in lumber costs is a rounding error in the housing affordability equation. The impact of lumber prices on housing costs is modest at best.
- Second, the impact of AD/CVD duties on housing costs thus far has been embarrassingly small, a rounding error to the rounding error. Indeed, the financial reporting of Canadian lumber producers call into question whether any percentage of the duties are being passed on to consumer of softwood lumber.
- Third, NAHB’s arguments regarding insufficient U.S. sawmilling capacity confuses cause and effect. The expansion of the U.S. industry since the trade case was brought has reduced the need for unfairly traded Canadian lumber and driven Canada’s market share to a level not seen since the 1970s.
By opposing the trade case, NAHB is promoting production in Canada at the U.S. industry’s expense.
But NAHB’s extensive campaign against any and all trade remedies has backfired. Instead of leading to a watering down of the trade case, it brought political attention to the fact that the United States, a country with expansive and growing timber resources, imports 24 percent of its lumber consumption from Canada, which consumes only 34 percent of its lumber production. The over-capacity of Canada’s export-oriented lumber industry and the manner in which it has distorted lumber markets to the detriment of forestry-dependent communities across the United States is now abundantly clear.
This has set in motion a potential new round of policies to rebalance the two country’s lumber industries in a way that significantly reduces Canada’s reliance on the U.S. market.
Bearing Down on NAHB’s False Claims About Softwood Lumber Costs and Housing Prices
The National Association of Homebuilders (NAHB) has been waging a campaign against the trade remedies applied on imports of Canadian softwood lumber since those measures were imposed in 2017. This campaign went into overdrive after the Trump administration announced that it was initiating an investigation that could result in additional measures being applied to U.S. imports of Canadian softwood lumber.[1]
NAHB’s effort knows no bounds. Its reach extends from the halls of Congress to articles printed in the smallest of small-town U.S. newspapers. These articles, and NAHB messaging in general, make several claims about the impact of softwood lumber costs on housing affordability, and about the U.S. industry’s ability to supply its own market. The not-so-subtle message is that the existing measures on Canadian softwood lumber are inflating the cost of new homes, and that any new measures will make things even worse.
The purpose of this essay is to review existing data on softwood lumber prices, housing costs, and domestic production capacity to assess the accuracy of NAHB’s claims. The data reviewed below support the following conclusions. First, NAHB’s claims regarding the link between softwood lumber cost trends and housing affordability are greatly exaggerated. The increase in softwood lumber costs is a rounding error in the housing affordability equation. Second, the impact of AD/CVD duties on housing costs thus far has been embarrassingly small, a rounding error to the rounding error. Indeed, the financial reporting of Canadian softwood lumber producers call into question whether any percentage of the duties are being passed on to consumer of softwood lumber. Third, NAHB’s arguments regarding insufficient U.S. sawmilling capacity confuses cause and effect. The expansion of the U.S. industry since the trade case was brought has reduced the need for unfairly traded Canadian softwood lumber and driven Canada’s market share to a level not seen since the 1970s.
The impact of softwood lumber prices on housing costs is modest at best.
The notion that the trade case against Canadian softwood lumber is a significant factor in housing affordability is not borne out by the data. Random Lengths (RL) publishes weekly and monthly data on softwood lumber prices. During 2024, the monthly RL composite price for softwood lumber averaged $400 per thousand board feet (MBF). The amount of wood required to construct a standard sized home is 15 MBF. Thus, the cost of softwood lumber in 2024, excluding transport prices and mark-ups, was about $6,000. The U.S. Census Bureau collects data on new residential home prices and publishes the mean price each month. In 2024, the average of these monthly new home prices was $506,208. Thus, this simple math tells us that the cost of softwood lumber is approximately 1.2 percent of the cost of a typical new home. If one assumes $75 per MBF in transport costs and a healthy 18 percent wholesaler margin, the builders’ cost of this softwood lumber in 2024 was $8,413, or just 1.7 percent of the price of a typical new home.
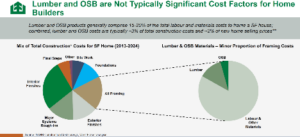
This is not rocket science—and it is well understood in the wood products industry. The analysis below was drawn from a 2024 investor presentation by the West Fraser Group, one of the largest Canadian exporters of softwood lumber to the United States.[2] West Fraser’s analysis is consistent with the estimate above, concluding that the combined costs of softwood lumber and oriented-strand board (“OSB”) account for approximately two percent of a new home’s selling price. What this means is that a 25 percent increase in the cost of softwood lumber to a builder, if passed through dollar per dollar to the price of a new home, would increase the price of a new home by 0.425 percent.[3] The direct price increase is even smaller if we consider the currently proposed 25 percent tariff on Canadian softwood lumber because Canada accounts for 24 percent of U.S. consumption.
Figure 1. Estimated Role of Softwood Lumber Costs in Homebuilder Costs
Of course, the increase in the price of a new home in recent years dwarfs anything that has happened to softwood lumber costs. Just looking at monthly averages of housing prices and costs over a ten-year period demonstrates the fallacy that increases in softwood lumber costs to homebuilders is a major cause of housing unaffordability. While the cost to builders of 15 MBF of softwood lumber increased by $1,240 from 2015 to 2024, the median new home price has increased by $157,567. Even if the price of softwood lumber did not increase at all, the price of a new home would have increased by more than $156,000. Even if softwood lumber were free, the price of a new home would have increased by more than $156,000. Even if homebuilders had reduced the price of a new home in 2024 by the cost of softwood lumber, the price of a new home in 2024 would have been $150,000 more expensive than a new home in 2015. So, the conclusion is pretty obvious: changes in the price of softwood lumber clearly were not the cause of housing price inflation in the United States over the past ten years.
Table 1. Median New Home Prices and Softwood Lumber Costs of a Standard New Home, 2015 and 2024[4]
| 12-month averages of | ||
| Median New Home Price | Builder’s Cost of 15 MBF Softwood Lumber | |
| 2015 | 348,642 | 7,173 |
| 2024 | 506,208 | 8,413 |
| Change | 157,567 | 1,240 |
Make no mistake, there was a period in the wake of COVID lockdowns when supply chain bottlenecks and an unexpected surge in demand caused prices for softwood lumber and other lumber products to spike. But those prices subsequently crashed–and crashed hard. While NAHB’s recent messaging focuses on recent increases in softwood lumber prices, hundreds of sawmills in Canada and the United States have had to close or curtail production in 2023 and 2024 due to depressed prices that do not allow producers to cover their costs. Yet NAHB has consistently behaved as if the current modest recovery of softwood lumber prices is inflating new home prices.[5]
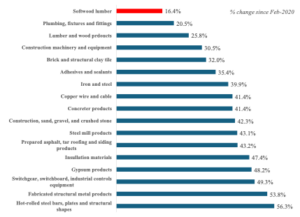
How misleading is NAHB’s analysis? Bureau of Labor Statistics data show that softwood lumber, the product for which U.S. duties offset Canadian unfair trade, have increased less than all other major non-energy construction commodities tracked by the Associated Builders and Contractors (ABC) since February 2020. The starting date of the comparison is important, because it reflects the U.S. pricing situation prior to the COVID lockdowns in March 2020. Thus, controlling for COVID-effects, the price of softwood lumber has increased far less than other non-energy housing inputs.
Figure 2. Changes in Construction Commodity Prices, Feb-2020 to February 2025[6]
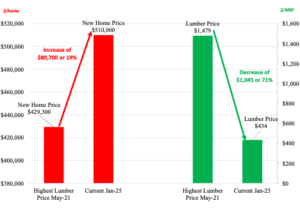
The following chart underscores the absurdity of NAHB’s argument better than anything. It compares the change in the price of new housing since May 2021, the month of peak lumber prices, with the change in the price of softwood lumber over that same period. To blame the housing availability crisis on softwood lumber pricing is absurd. Even if there were lags in price transmission to homebuilders, it has been 43 months since softwood lumber prices peaked. Since then, new housing prices have increased by 19 percent, while softwood lumber prices declined by 71 percent.
Figure 3. Trends in New Home Price and Random Lengths Composite Price for Softwood Lumber[7]
The duties offsetting Canada’s unfair trade have an even smaller impact on housing prices.
The existing measures on imports of softwood lumber exist for a reason. In May of 2016, the United States Lumber Coalition petitioned the Department of Commerce and the United States International Trade Commission for relief from unfairly traded imports of softwood lumber from Canada. The Department of Commerce found that the Canadian government was subsidizing the Canadian industry, and that the Canadian industry was dumping softwood lumber into the U.S. market.[8] The International Trade Commission found that these dumped and subsidized imports injured the U.S. industry. The Canadian producers and government have launched a barrage of appeals of these determinations and subsequent reviews, but the initial and subsequent findings have survived review under the NAFTA and the USMCA.
NAHB does not like these remedial duties that respond to Canada’s unfair trade practices and spends an extraordinary amount of energy opposing them. NAHB’s list of lobbying activities is extensive. Its “Team Lumber Report” covering activities from August 2020 to January 2022 is 24 pages long and include multiple presentations, letters and meeting in which NAHB pushes a softwood lumber agreement, meets with Canadian officials, opposes Commerce Department findings that adjust duties on Canadian softwood lumber imports based on annual administrative reviews, and criticizes the administration for allowing the duties to increase.
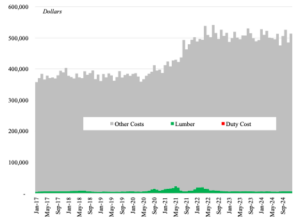
It goes without saying that the duties on Canadian softwood lumber have had an even smaller impact on housing prices than the price of softwood lumber itself. Since provisional measures were imposed in April 2017, the deposit rates paid on Canadian softwood lumber imports have ranged from 8.59 percent to 20 percent. From August to December 2024, those rates have been 14.4 percent, while the Random Lengths composite for softwood lumber has averaged $415 per MBF. Thus, if every single piece of softwood lumber used in the framing of a new home were subject to the trade remedy duties, the cost of the measure would be $897 for a standard home using 15 MBF of softwood lumber. But since the Canadian share of the U.S. market for softwood lumber was only 23.6 percent during this period, the added cost of the duty to the average home would be a mere $212. That is why the cost associated with the duties in recent years is barely visible with the naked eye in this graph showing the price of the median home, the cost of softwood lumber, the cost of the duties, and other costs.
Figure 4. Softwood Lumber Duties Compared to Softwood Lumber Costs, and Other Costs (including Homebuilder Profits and Commissions)[9]
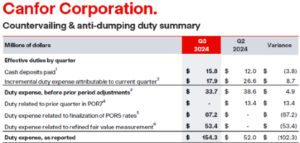
NAHB frequently claims that the costs associated with the softwood lumber duties are passed on to consumers. This assertion is also suspect. As an economic matter, the extent to which duties are passed through to consumers is determined by a number of factors. If the full duty is passed through from wholesalers to builders and the homebuyer, then the homebuyer would be the one paying the duty. However, the financial disclosures of publicly owned Canadian companies indicate that they are selling at the market price and absorbing the duty. For example, Canfor’s investor call presentation for the third quarter of 2024 clearly indicates that it is paying the AD/CVD deposits. Likewise, if Canfor is subsequently found not to have dumped in a given year, it would be entitled to receive these funds back from the U.S. government with interest. In short-one of the lynchpins of NAHB’s messaging—that U.S. consumers are paying the full AD/CVD duties on Canadian softwood lumber—is also a sweeping exaggeration.[10]
Figure 5. Canfor Corporation’s Duty Summary[11]
So Why Does NAHB Make These Claims?
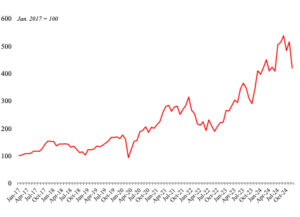
The question remains, if softwood lumber costs and the softwood lumber duties are not the cause of higher housing prices, why does NAHB spend so much time pretending they are? While NAHB blames lumber prices for the housing affordability crisis, a look at the stock market performance of the country’s top homebuilders makes one wonder whether NAHB’s actual motive is to divert unwelcome attention from homebuilders’ financial performance given the prominence of housing affordability in policy circles.
Figure 6. Homebuilders’ Stock Price Index, Equal Weights, January 2017 to December 2024[12]
The Trade Remedy Orders Have Helped to Expand U.S. Production and Reverse Canada’s Share Gains.
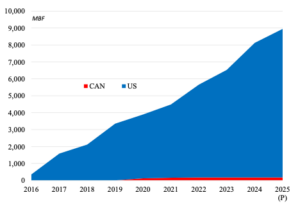
Regardless of NAHB’s motive, one thing is clear: the trade remedy orders offsetting Canadian dumping and subsidies have had many positive effects on the domestic softwood lumber industry. Since the filing of the trade cases against Canadian softwood lumber, 98 percent of new mill capacity in North America was built in the United States, versus 2 percent in Canada. Capacity expansions of existing mills have also favored the United States. By volume, 74 percent of mill expansions have occurred in the United States, compared to 26 percent in Canada.
Figure 7. Cumulative Capacity of New Mills, by Country[13]
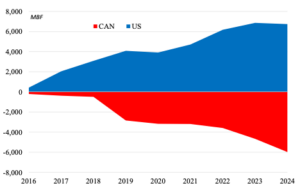
On the other hand, contractions have been concentrated in Canada. Canadian sawmills have accounted for 74 percent of curtailments since 2018 when the orders were published. Canadian mills have also accounted for 57 percent of mill closures since 2016. Taking into account new mill construction, expansions of existing mills, and closures, Canadian mills have lost almost 6 billion board feet in capacity while U.S. mills have gained 6.7 billion board feet in capacity since 2016.
Figure 8. Net Change (New Mills + Expansions – Closures) Cumulative Capacity, by Country[14]
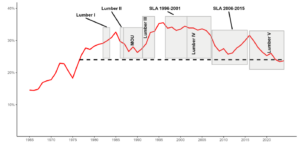
These capacity trends are reflected in Canada’s share of U.S. consumption. The figure below presents Canada’s market share over the last six decades, as well as the various efforts to cope with Canada’s excessive reliance on the U.S. market. Canada’s market share has declined markedly since the trade remedy orders colloquially referred to as Lumber V went into effect. Canada’s share of the U.S. consumption has fallen in recent years to levels last prevailed during the 1970s.
Figure 9. Canada’s Share of the U.S. Softwood Lumber Market, 1965 to 2024[15]
Thus, the Lumber V trade remedies against Canadian softwood lumber have helped expand U.S. sawmill capacity, limited the expansion of Canada’s industry, and reversed Canada’s share gains, while having little, if any, detectable long-term impact on U.S. housing prices.
NAHB’s messaging has shifted in recent months with a greater focus on what it claims is the inability of the U.S. industry to supply the country’s softwood lumber demand. This is an interesting argument. As described above, the U.S. industry has expanded significantly since the trade remedies were imposed. By seeking to replace the trade case, NAHB is, in effect, working to prevent U.S. production from supplying an even larger share of the domestic market. In fact, the U.S. industry has significant capacity right now to supply a greater share of domestic consumption of softwood lumber. The industry’s current operating rate in 2024 was approximately 78 percent, and many facilities that could increase supply of U.S. produced softwood lumber are currently curtailed due to the continued presence of unfairly traded imports from Canada.[16] The U.S. industry could increase production by another 10-15 percent with better pricing which would be achieved if strong enforcement of the trade laws prevented dumped and unfairly subsidized imports from entering the U.S. market.
By opposing the trade case, NAHB is promoting production in Canada at the U.S. industry’s expense. British Columbia accounts for more than a third of Canada’s exports of softwood lumber to the United States. In 2024, BC exported two-thirds of its production to the United States. It is a well-known fact in the industry that producers based on the Canadian province of British Columbia are now the high-cost producers in North America. Indeed, Canfor, the largest producer in BC, exported softwood lumber at prices that resulted in the Commerce Department calculating a 34.61 percent dumping margin for the firm’s sales in 2023.[17] Canfor’s lumber operations lost a cumulative CAD 1.0 billion in 2023 and 2024.
In any event, NAHB’s comments on the lack of U.S. supply backfired. Instead of leading to a watering down of the trade case, it brought political attention to the fact that the United States, a country with expansive and growing timber resources, imports 24 percent of its softwood lumber consumption from Canada, which consumes only 34 percent of its softwood lumber production. The over-capacity of Canada’s export-oriented softwood lumber industry and the manner in which it has distorted softwood lumber markets to the detriment of forestry-dependent communities across the United States is now abundantly clear. This has set in motion a potential new round of policies to rebalance the two country’s softwood lumber industries in a way that significantly reduces Canada’s reliance on the U.S. market.
[1] “Addressing The Threat To National Security from Imports of Timber, Lumber,” Presidential Actions, March 1, 2025 at https://www.whitehouse.gov/presidential-actions/2025/03/addressing-the-threat-to-national-security-from-imports-of-timber-lumber/.
[2] West Fraser Group Investor Presentation, Feb. 2025, slide 21.
[3] 1.7 percent of a new home’s selling price multiplied by 25 percent equals 0.425 percent. Note that this estimate assumes full pass-through to the consumer and is applied to the lumber cost inclusive of transportation expenses and distributor’s markup.
[4] Sources: Home prices are annual averages of monthly median home prices. Builders’ lumber cost = 1.18 * (Average of monthly RL composite softwood lumber price * (1 + duty deposit rate) + $75) St. Louis FRB database (FRED) series ASPNHSUS; (Census Bureau, “New Residential Construction” mean sales price, not seasonally adjusted); and Random Lengths Framing Composite, Random Lengths Yardstick (monthly).
[5] See, for example, NAHB, “Softwood Lumber Prices Continue to Lead Price Growth for Building Materials,” March 13, 2025 (https://eyeonhousing.org/2025/03/softwood-lumber-prices-continue-to-lead-price-growth-for-building-materials/) The headline itself is not accurate. The article’s own graph shows that softwood lumber prices had been declining for nearly two years prior to a few months of modest recovery. As acknowledged in the body of the article, prices of softwood lumber and other wood commodities “experienced little growth for most of 2024.”
[6] Source: Bureau of Labor Statistics data summarized in “ABC: Construction Materials Prices Increase 0.6%, Steel Surges Nearly 4% in February”, https://www.abc.org/News-Media/News-Releases/abc-construction-materials-prices-increase-06-steel-surges-nearly-4-in-february
[7] Sources: New Home Price – St. Louis FRB database (FRED) series ASPNHSUS; (Census Bureau, “New Residential Construction” mean sales price, not seasonally adjusted). Lumber Price- Random Lengths Framing Composite price.
[8] In trade parlance, dumping means that the imported product is being sold in the United States at prices that are 1) lower than sales prices in the market where they are produced; 2) lower than the cost of production; or 3) in rare cases lower than prices in a viable third country market.
[9] Sources: Other Costs represent the difference between the mean new home sales prices and the imputed cost of 15 MBF of softwood lumber. Lumber cost to builder = 1.18*(RL framing composite price * (1+ deposit rate) *15 + $75). Duty deposit = RL framing composite price * (1+ deposit rate) *15. St. Louis FRB database (FRED) series ASPNHSUS; (Census Bureau, “New Residential Construction” mean sales price, not seasonally adjusted); Random Lengths Framing Composite, Random Lengths Yardstick (monthly); duty deposit rate reflects the combined “All others rate”.
[10] Through the end of 2024:Q3, Canfor had paid cumulative cash deposits related to the order of $971 million. See Canfor Financial performance overview – Quarter 3, 2024 at slide 5.
[11] Canfor Financial performance overview – Quarter 3, 2024 at slide 5.
[12] Includes stock prices of sixteen homebuilders in the ITB Homebuilders’ Index. The included firms are DR Horton, Lennar (class A shares), Pulte Group, NVR, Taylor Morrison Home, Meritage, Toll Brothers, Century Communities, LGI Homes, MDC Holdings, M I Homes, Beazer Homes, The Point Homes, Green Brick Partners, and Skyline Champion. MDC Holdings delisted in 2024.Q2 and is not included from there on.
[13] Forest Economic Advisors’ sawmill database.
[14] Forest Economic Advisors’ sawmill database.
[15] Sources: 1965-2014 data: USDA, U.S. Timber Production, Trade, Consumption, and Price Statistics, 1965-2017, July 2019 at Tables 30, 31, and 32; 2015-2024 data: WWPA Lumber Track Reports (U.S. consumption of softwood lumber); USITC Dataweb (U.S. imports of softwood lumber from Canada).
[16] According to the latest data from the Western Wood Products Association, U.S. Capacity Utilization in December 2024 was a mere 73 percent.
[17] Because of the way U.S. trade law works, these duties will not go into effect until August 2025.